Analysis of Medium- and Heavy-Duty Vehicles Dataset
oswaldo@joceballos.com
www.joceballos.com
PhD Renewable Energy
Introduction
The dataset provides detailed information about medium- and heavy-duty vehicles. It includes fields such as vehicle models, battery capacities, manufacturers, application categories, and fuel types. This report presents three visualizations generated from the dataset and provides an analysis of the findings. The main idea is to observe the uses of electric vehicles.
Data Fields Description
| Field | Type | Description |
|---|---|---|
| Vehicle ID | Integer | A unique identifier for this specific vehicle. |
| Model | String | The vehicle’s model name. |
| Manufacturer | String | The vehicle’s manufacturer. |
| Transmission Make | String | The manufacturer of the available transmission(s) in the vehicle. |
| Num Passengers | String | The maximum number of passengers that a bus can accommodate. |
| Power System IDs | Array | An identifier for a specific vehicle power system. |
| Fuels | Array | The fuels or technologies available for the vehicle. |
| Application Categories | Array | The duty application(s) of the vehicle. |
| Transmission Types | Array | The type of transmission (e.g., manual or automatic) in the vehicle. |
Visualizations and Analysis
1. Battery Capacity by Model

This bar plot shows the battery capacity (kWh) for various vehicle models. Only models with complete data on the Battery.Capacity.kWh..max. field were included.
Findings:
- There is significant variability in battery capacities across models.
- Certain models demonstrate higher battery capacities, indicating suitability for extended operations or heavy-duty applications.
2. Distribution of Application Categories

This bar plot displays the frequency of application categories for the vehicles. It highlights how vehicles are categorized based on their duty applications. The main idea is to observe the use of electric vehicles.
Findings:
- Some categories are more common, likely due to their broader use in transportation industries.
- The distribution can guide manufacturers and policymakers in identifying gaps or overrepresentation in certain application areas.
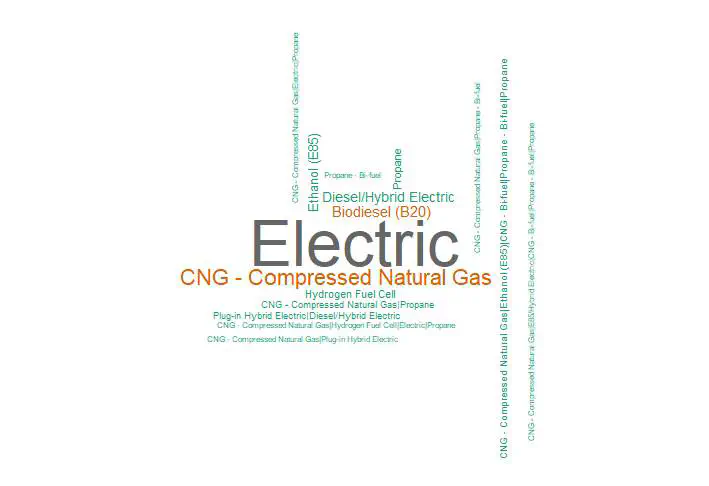
3. Fuel Types Distribution (Word Cloud)

A word cloud was created to visualize the distribution of fuel types. Larger words represent more frequent fuel types in the dataset.
Findings:
- Certain fuel types dominate, such as diesel and electric, reflecting current trends in medium- and heavy-duty vehicle markets.
- Emerging technologies or niche fuels appear less frequently, suggesting potential areas for development or innovation.
Technical Implementation
Data Cleaning
The dataset was filtered to ensure only complete cases for relevant fields were included in each analysis. For example:
cleandata <- data[complete.cases(data[, c("Model", "Battery.Capacity.kWh..max.")]), ]
Visualizations
- Battery Capacity by Model:
ggplot(cleandata, aes(x = Model, y = `Battery.Capacity.kWh..max.`)) +
    geom_bar(stat = "identity", fill = "skyblue") +
    labs(title = "Battery Capacity (kWh) by Model", x = "Model", y = "Battery Capacity (kWh)") +
    theme(plot.title = element_text(hjust = 0.5)) +
    theme(axis.text.x = element_text(angle = 45, hjust = 1))
- Application Categories Distribution:
category_counts <- data %>% count(Application.Categories)

ggplot(category_counts, aes(x = Application.Categories, y = n)) +
    geom_bar(stat = "identity", fill = "skyblue") +
    labs(title = "Distribution of Application Categories", x = "Application Category", y = "Count") +
    theme_minimal() +
    theme(axis.text.x = element_text(angle = 45, hjust = 1), plot.title = element_text(hjust = 0.5))
- Fuel Types Word Cloud:
Fuels_count <- data %>% count(Fuels)

wordcloud(words = Fuels_count$Fuels, freq = Fuels_count$n, min.freq = 1, max.words = 200, random.order = FALSE, rot.per = 0.35, colors = brewer.pal(8, "Dark2"))
Conclusion
The visualizations provide insights into battery capacities, application categories, and fuel types in medium- and heavy-duty vehicles. These insights can guide future research, manufacturing strategies, and policy-making to address trends and gaps in the market.