PEMFC Curves Tool
oswaldo@joceballos.com
www.joceballos.com
Phd Renewable Energy
A user interface to build the polarization and power curves of a 1-D isothermal model of a PEM Fuel Cell.
This app is based on the work of the APPENDIX B MATLAB® code, page 443, for the simulation of PEMFC from the book “FUEL CELL MODELING AND SIMULATION from microscale to macroscale” by Gholam Reza Molaeimanesh and Farschad Torabi. This app will construct the polarization and power density curves of the example 2.11, page 199. The code has been modified to display only the polarization and power density curves without the concentrations and voltage looses curves to understand the basic behavior of a PEMFC when the operation pressure and thickness of the components change.
Installation
To use this app built in Appdesigner (an interactive development environment for designing an app layout and programming its behavior) you need to have installed MATLAB® R2021a. Unzip the file mypemfc.zip. Open the command window, navigate where the file mypemfc.app is located, and type “mypemfc”. Or you can use the search folder toolbar.
  >>cd ../mypemfc
  >>mypemfc
  >>
How to use it
Main window
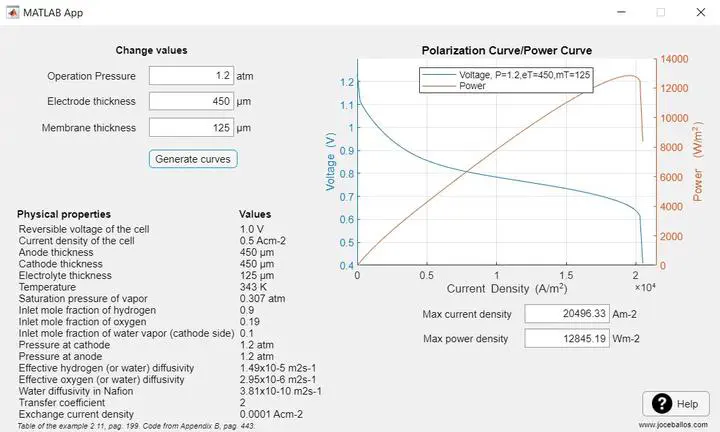
The main window displays three areas: 1-The boxes where you can change the operation pressure of the anode and cathode, and the thickness of the electrodes (GDL/CL) and the membrane. 2-The table with the values of the parameters in which example 2.11 was built. 3-The plot figure where the curves are displayed and of the current and power density.

First run
Click on the “Generate curves” to obtain the curves according to the example 2.11. A message is prompted to indicate that the calculations are running.

First results
The current and power density curves are displayed in the main window and an external plot Figure window that will keep a record of the different curves generated for the next runs.

Next results
The new current and power density curves are displayed in the main window with the new values of current and power density. But also, in the plot Figure window, the new curves are displayed together with the previous curves to observe the behavior when a parameter is changed. In the plot Figure window, you can move the legend box, maximize the windows, make annotations, and other utilities.

Note
As with any simplified model, has its limitations. This is an illustrative application to be used as an extra educational resource to understand the fundamentals of a PEM Fuel Cell. The code can be modified as well to adapt it to your own needs.