Basic Fuel Cell Performance Analysis Application
oswaldo@joceballos.com
www.joceballos.com
Phd Renewable Energy
Overview
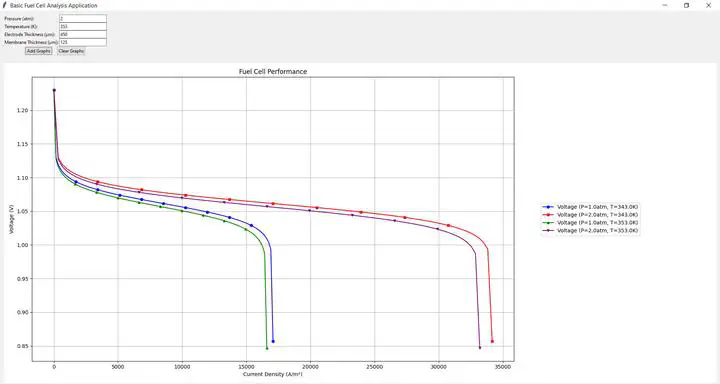
This is a Python-based graphical application for analyzing and visualizing fuel cell performance characteristics. The application allows users to explore voltage polarization curves by varying key parameters such as pressure, temperature, electrode thickness, and membrane thickness.
Features
- Interactive GUI for fuel cell parameter input
- Voltage polarization curve generation
- Multiple run support with color-coded and marker-differentiated plots
- Ability to overlay multiple runs for comparative analysis
Requirements
- Python 3.8+
- NumPy
- SciPy
- Matplotlib
- Tkinter
Installation
Clone the Repository
git clone https://github.com/yourusername/fuel-cell-analysis.git
cd fuel-cell-analysis
Install Dependencies
# Python library dependencies for the Fuel Cell Analysis Application
numpy==1.24.0         # For advanced mathematical computations and array operations
scipy==1.10.0         # For solving non-linear equations and optimization
matplotlib==3.7.0     # For creating interactive plots and visualizations
tkinter (builtin)     # GUI library included with Python standard library
random (builtin)      # Standard library for generating random numbers
Usage
- Run the application:
python fuel_cell_analysis.py
Input Parameters:
- Pressure (atm)
- Temperature (K)
- Electrode Thickness (µm)
- Membrane Thickness (µm)
Generate Plots:
- Click “Add Graphs” to plot the current configuration
- Click “Clear Graphs” to reset the plot area
Parameters Explanation
- Pressure: Operating pressure of the fuel cell (in atmospheres)
- Temperature: Cell operating temperature (in Kelvin)
- Electrode Thickness: Thickness of the electrode layer (in micrometers)
- Membrane Thickness: Thickness of the proton exchange membrane (in micrometers)
Visualization
The application generates a voltage polarization curve showing:
- X-axis: Current Density (A/m²)
- Y-axis: Cell Voltage (V)
Customization
- Multiple runs can be plotted with different colors and markers
- Legend shows the specific parameters for each run
Contributing
Contributions are welcome! Please feel free to submit a Pull Request.
Author
For questions or feedback, reach out via email at oswaldo@joceballos.com or open an issue on the repository.